Enhancing Observability in Serverless Applications with AWS Lambda PowerTools Tracing
Lambda PowerTools Tracing gives you X-Ray distributed traces with almost zero config. Here's how to instrument cold starts, segments, and subsegments the right way.

Introduction
In the world of serverless computing, the importance of observability cannot be overstated. AWS Lambda stands out as a scalable and flexible platform, but understanding serverless applications’ behavior requires effective monitoring tools. This is where AWS Lambda PowerTools Tracing plays a crucial role, offering a sophisticated solution to boost observability in serverless architectures.
The Critical Role of Observability
Serverless computing, with its statelessness and event-driven nature, demands unique approaches to monitoring and debugging. Traditional tools often fall short, making comprehensive observability — the ability to infer internal system states from external outputs — a necessity.
Observability Components
- Logging: Detailed application activity logs.
- Tracing: Tracking request journeys through various components.
- Metrics: Data points aggregation for performance insights.
AWS Lambda PowerTools: Enhancing Serverless Observability
AWS Lambda PowerTools, a utilities suite for Lambda, enriches observability by simplifying logging, metrics, and tracing. It streamlines the implementation of these components, leading to more efficient and reliable serverless applications.
PowerTools Tracing and Observability
Simplified Tracing
PowerTools Tracing automates tracing in serverless applications, providing insights into Lambda function executions and AWS service interactions.
Enhanced Logging
Integration with Middy middleware through PowerTools enriches logging, crucial for issue diagnosis and application behavior understanding.
Efficient Metrics Collection
PowerTools facilitates efficient metrics collection, crucial for proactive issue resolution and performance monitoring.
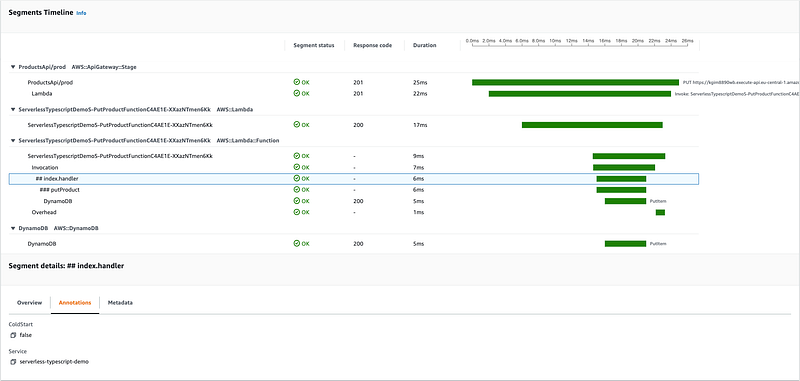
Integrating PowerTools Tracing with AWS X-Ray
A notable feature of AWS Lambda PowerTools is its seamless integration with AWS X-Ray. This service offers a detailed view of requests within your AWS environment, crucial for deep application insights.
AWS X-Ray: In-Depth Application Analysis
AWS X-Ray works in tandem with PowerTools Tracing to offer:
- Automatic Trace Collection: Traces are automatically sent to AWS X-Ray, simplifying configuration.
- Detailed Service Maps: Visual representations of application components and interactions.
- Performance Analysis: Latency analysis and performance issue identification across distributed services.
- Filtering and Segmentation: Specific request, user, or error-focused trace data analysis.
Implementation Example
Here’s a basic implementation of PowerTools in a Lambda function:
import middy from '@middy/core';
import { Tracer } from '@aws-lambda-powertools/tracer';
import { Logger } from '@aws-lambda-powertools/logger';
const tracer = new Tracer({ serviceName: 'your-service' });
const logger = new Logger({ serviceName: 'your-service' });
const lambdaHandler = async (event, context) => {
    logger.info('Function started');
    // Function logic here
    logger.info('Function completed');
    return { statusCode: 200, body: JSON.stringify({ message: 'Success' }) };
};
export const handler = middy(lambdaHandler)
    .use(captureLambdaHandler(tracer))
    .use(injectLambdaContext(logger));
Further Resources
For comprehensive information on implementing PowerTools Tracing, refer to the AWS PowerTools Tracer Documentation. This resource provides guides, advanced features, and best practices.
Conclusion
Observability is a cornerstone in serverless computing. AWS Lambda PowerTools Tracing, especially when integrated with AWS X-Ray, offers a potent solution for enhancing visibility into serverless applications. By adopting these tools, you ensure not just the efficiency and power of your serverless applications but also their transparency and manageability.